Building Agent Interfaces: Lessons from Chrome DevTools (MCP) for Agents — Michael Hablich, Google
Description
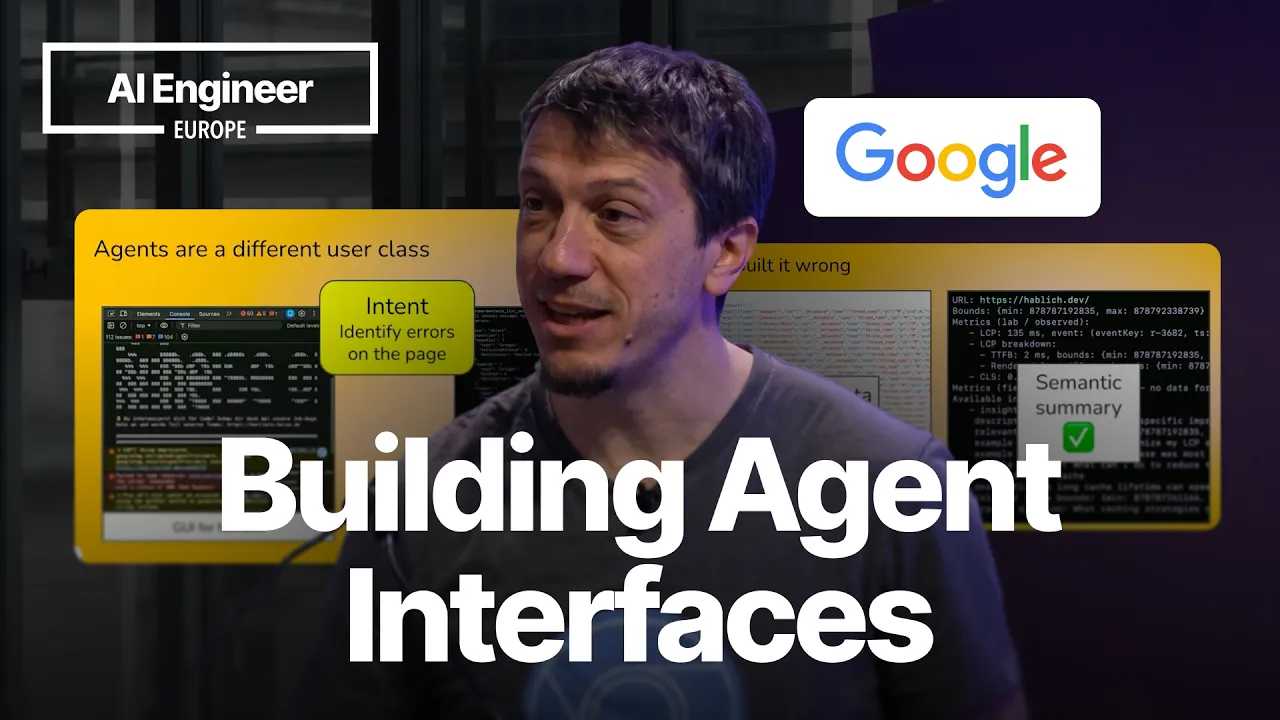
Chrome DevTools MCP shipped with one tool: debug_webpage. Agents failed silently because they couldn't compose behaviors. The team decomposed it into 25 focused tools and assumed the problem was solved. It wasn't — now agents had 25 tools and no reliable way to pick the right one. Michael Hablich's talk is an honest account of building the same thing wrong three times and what the fixes actually looked like. The concrete lessons: semantic summaries instead of raw 50,000 line JSON trace files, error messages rewritten so agents can self heal without a human in the loop ("Cannot navigate back, no previous page in history" instead of "Unable to navigate back in currently selected page"), a metric called tokens per successful outcome to measure interface fuel efficiency, and a deliberate decision to keep the autoconnect friction rather than remove it once they thought through prompt injection and the lethal trifecta. Speaker info: - https://x.com/MHablich - https://www.linkedin.com/in/michael-hablich/
Summary
Generated by claude-sonnet-4-5At-a-Glance
- Verdict: Watch fully
- Core thesis: Building agent interfaces requires treating agents as a separate user segment with distinct cognitive bottlenecks (token burn, error recovery, tool discoverability, trust boundaries) rather than simply exposing existing human APIs
- Why it matters: Chrome DevTools team shipped a purpose-built agent interface (MCP server) and learned hard lessons about token efficiency, schema design, error handling, and security boundaries that apply to any agent tooling
- Best use: Watch to understand practical engineering tradeoffs when building MCP servers or agent tools—especially the metrics, anti-patterns, and security models that Chrome DevTools validated at scale
Executive Summary
Michael Hablich, Chrome DevTools PM at Google, presents four engineering lessons from building Chrome DevTools for Agents—a purpose-built MCP server for debugging web pages. The talk addresses a fundamental mistake: assuming agents could consume raw data dumps (like 50,000-line performance trace JSON files) simply because they're machines. Instead, agents need semantic summaries, minimal token interfaces, and careful schema design. The Chrome DevTools team measures success with 'tokens per successful outcome,' a fuel-efficiency metric balancing task completion against token/time cost, and tracks it per user journey rather than globally.
The four lessons cover token burn rate (offering slim mode with 3 tools vs. full 25-tool suite; CLI pipelines for post-processing), error recovery (actionable error messages enabling self-healing, proactive detours away from unsuitable tools, diagnostic playbooks for setup issues), tool discoverability (decomposing monolithic 'debug web page' into 25 specialized tools, then fighting context-window bloat with minimal viable descriptions and activation criteria), and trust boundaries (rejecting user requests to 'remember my choice' on auto-connect because consent friction is security by design in local/CI/internet agent tiers).
Key tradeoffs: more descriptive schemas increase context windows and bias smaller models; fewer tools reduce tokens but limit agent capability; error playbooks enable self-healing but add upfront description cost; friction in consent protects against prompt injection but annoys users. The team validated these patterns across Gemini CLI, Claude Code, and other MCP clients. The talk is dense with actionable anti-patterns (don't expose niche tools by default, don't train agents on 14-step checkout flows) and a named metric (tokens per successful outcome) that Ken can apply immediately to agent tooling design.
Key Takeaways
- Claim: Raw data dumps kill agent performance even when the data is machine-readable JSON | Evidence: Chrome DevTools initially threw 50,000-line performance trace JSON files at agents 1.5 years ago; agents blew through context windows and entered 'the dump zone' (reference to Matt's talk). The team replaced raw traces with markdown semantic summaries containing only key metrics (LCP, INP, CLS) and the agent outcome improved dramatically. | Caveat: The raw trace is still available for post-processing with other tools if needed, so this is semantic preprocessing rather than loss of fidelity; works for performance profiling but may not generalize to all data types. | Implication: Ken should assume agents need curated, human-legible summaries rather than machine APIs; invest in semantic compression layers for any data-heavy tooling. | Timestamp: 03:45
- Claim: Tokens per successful outcome is the fuel efficiency metric for agent interfaces, but only meaningful within a single user journey | Evidence: Chrome DevTools tracks token cost, tool calls, and duration per task class (web scraping vs. responsive layout debugging). Web scraping is cheap; debugging is expensive but appropriately so. Comparing them globally is meaningless. The team uses horizontal bar charts showing longer bars = more effective tools per use case, guiding optimization priorities. | Caveat: The metric is worthless if the agent can't complete the journey (fuel efficiency without reaching destination). Also requires separate measurement per user journey/task class, not a global KPI. Imperfect measurement beats gut-driven decisions, but it's not straightforward to instrument. | Implication: Ken should instrument tokens + success per workflow before optimizing schema; use it to prioritize which tools to slim down or which error messages to improve, not as a vanity metric. | Timestamp: 07:20
- Claim: Chrome DevTools decomposed a monolithic 'debug web page' tool into 25 specialized tools, then had to fight context-window bloat and tool confusion | Evidence: Initial design was one tool accepting natural-language prompts (neat engineering, didn't work). After decomposition, agents had 25 choices and struggled with discoverability. The team now uses 'minimum viable description' with purpose definition and activation criteria (e.g., 'used to find performance issues and core web vitals: LCP, INP, CLS' so agents connect 'improve page load' → performance.trace tool). Slim mode exposes only 3 tools (select page, navigate, evaluate script) for ultra-low token cost but sacrifices capability (e.g., can't get network requests). | Caveat: More descriptive schemas increase context window size and bias smaller models to overuse tools. Fewer tools reduce tokens but force extra turns or incomplete solutions. The tradeoff is endless and model-dependent. Skills/playbooks help but add their own context cost if overused. | Implication: Ken should expect tool proliferation → discoverability crisis and plan schema optimization as a continuous process, not a one-time fix; consider slim/full modes as deployment options. | Timestamp: 12:30
- Claim: Error recovery is a spectrum: actionable error messages enable self-healing, proactive detours correct training data biases, diagnostic playbooks fix setup issues | Evidence: Example error message: 'Unable to navigate back in selected page. History entry to navigate was not found.' Adding the last sentence enabled agents to self-fix. Proactive detours steer agents to start performance trace instead of Lighthouse audit (correcting training data). A troubleshooting skill helps agents and humans fix MCP server setup issues without human intervention. | Caveat: Every retry costs tokens, so recovery playbooks must be efficient. Proactive detours override model training, which may confuse the agent if overused. Diagnostic playbooks add upfront description cost and context window pressure. | Implication: Ken should treat error messages as agent UX and invest in self-healing guidance; consider which tool confusions are worth overriding with detours vs. fixing in schema. | Timestamp: 10:00
- Claim: Trust boundaries require consent friction by design, even when users request 'remember my choice'—removing friction in agent delegation creates backdoors | Evidence: Chrome DevTools offers auto-connect (share your browser session with agent). Users requested 'remember my choice' to skip the allow dialog. The team refused because the local dev environment (tier 1) has full profile access, full internet, and human-in-loop; removing consent creates a lethal trifecta (Simon Willison blog). Tier 2 (CI) uses containers + separate profiles; tier 3 (internet agents) needs domain allowlists + prompt injection mitigations. | Caveat: Friction annoys users and reduces agent autonomy; the team explicitly chose security over convenience. This model applies to browsing agents and may not generalize to sandboxed tools. The tier model (local/CI/internet) may not fit all architectures. | Implication: Ken should design consent flows assuming agents will be prompt-injected and never auto-grant access across trust boundaries; tier the security model by environment, not by tool capability. | Timestamp: 15:45
- Claim: 97% of MCP tool descriptions have quality smells, and schema is the UI for the agent | Evidence: Reference to an unnamed paper. Chrome DevTools iteratively improved descriptions to include purpose (core function) and usage guidelines (activation criteria). Example: performance.trace lists LCP/INP/CLS metrics so agents connect 'improve page load' to the right tool. The team is 'far from finished optimizing' because models and harnesses keep changing. | Caveat: Better descriptions increase context window size and can bias smaller models to overuse tools. The tradeoff space is model-dependent and evolving. The paper is referenced but not named, so Ken can't verify the 97% claim without hallway-track follow-up. | Implication: Ken should audit MCP server schemas for vague purpose statements and missing activation criteria; treat schema design as continuous product work, not documentation. | Timestamp: 13:20
Detailed Brief
Agents are a distinct user segment with non-visual cognitive bottlenecks
- Claims: Agents and humans share intent (identify and fix errors) but differ in cognitive load; Humans need visual complexity (layout, color, UI) to find signal; agents prefer schema clarity and data density; Chrome DevTools for humans is a million-user product with console UI, visual panels; Chrome DevTools for Agents is a text-based MCP server with 25 tool schemas
- Evidence: Console UI screenshot shows colored error messages for human debugging; MCP schema for performance endpoints shown as structured JSON; Initial assumption: agents can handle raw data dumps because they're machines → disproven by 50,000-line trace file failure
- Caveats: The visual/non-visual distinction may oversimplify: LMMs can process visual input, but token cost remains; Agent preferences are model-dependent and evolving; today's schema design may not work for next-gen models
- Implications: Ken should treat agent interface design as a separate product discipline, not an API afterthought; Visual tools for humans and text schemas for agents can coexist but require parallel design effort
Token burn rate and the tokens-per-successful-outcome metric
- Claims: Every input/output token costs money; every reasoning step costs money; token burn is the fuel efficiency of agent interfaces; Tokens per successful outcome balances effectiveness (did the agent complete the journey) and efficiency (token/time/call cost); The metric must be tracked per user journey/task class, not globally, because web scraping is cheap and debugging is expensive by nature
- Evidence: Chrome DevTools uses horizontal bar charts with longer bars = more effective tools per use case; Team focuses optimization on shorter bars (less effective tools); Example: web scraping uses fewer tokens than responsive layout debugging, but both are 'successful outcomes' in their respective journeys
- Caveats: Fuel efficiency is worthless if the agent can't reach the destination (don't optimize away capability); Measurement is not straightforward and may be imperfect, but better than gut-driven decisions; Comparing token costs across different task classes is misleading
- Implications: Ken should instrument token cost + success rate per workflow before optimizing any agent tool; Use the metric to prioritize which tools to slim, which errors to improve, which descriptions to shorten; Do not use it as a global KPI or compare unrelated workflows
Three approaches to reducing token burn: categorization, slim mode, CLI post-processing
- Claims: Tool categorization hides niche tools (e.g., Chrome extension debugging) from default context window; Slim mode exposes only 3 tools (select page, navigate, evaluate script) for ultra-low token cost but sacrifices capability; CLI interface enables command chaining and post-processing without burning model tokens
- Evidence: Slim mode example: can't get network requests because only evaluate script is available; CLI example: accessibility tree extraction piped into click command, saving tokens by avoiding model processing; Tool categorization removes unused tools from context, reducing baseline token load
- Caveats: Slim mode forces extra turns or incomplete solutions; tradeoff between token efficiency and task capability; CLI chaining requires the agent or user to know shell syntax; may not work for all models/harnesses; Hiding niche tools may break workflows that actually need them; requires per-use-case tuning
- Implications: Ken should offer multiple deployment modes (full/slim) rather than one-size-fits-all; CLI interfaces are underrated for token savings if the agent can chain commands; Tool visibility is a tuning knob, not a fixed decision
Error recovery spectrum: actionable messages, proactive detours, diagnostic playbooks
- Claims: Useful error messages enable agent self-healing without human intervention; Proactive detours override model training when the model is biased toward the wrong tool; Diagnostic playbooks help agents and humans fix setup issues (e.g., MCP server misconfiguration)
- Evidence: Error message example: 'Unable to navigate back. History entry not found.' → adding 'History entry not found' enabled self-healing; Proactive detour: steer agents to start performance trace instead of Lighthouse audit (correcting training data); Troubleshooting skill addresses common MCP server setup problems
- Caveats: Every retry costs tokens, so recovery must be efficient; Proactive detours override training, which may confuse agents if overused; Diagnostic playbooks add context window cost and may not cover all failure modes
- Implications: Ken should treat error messages as agent UX, not developer debug output; Consider which tool confusions are worth detours vs. schema fixes; Self-healing playbooks are high-ROI but must be targeted at common failures
Tool discoverability: from monolithic to 25 tools to minimum viable descriptions
- Claims: Initial design: one 'debug web page' tool accepting natural-language prompts (neat engineering, didn't work); Decomposed into 25 specialized tools → agents struggled to pick the right one; Solution: minimum viable descriptions with purpose + activation criteria (e.g., 'used for performance issues: LCP, INP, CLS'); Skills can supercharge workflows but add context cost and risk tool overuse
- Evidence: Performance.trace description includes 'LCP, INP, CLS' so agents connect 'improve page load' → this tool; Team is 'far from finished optimizing' because models and harnesses keep changing; Reference to unnamed paper: 97% of MCP tool descriptions have quality smells
- Caveats: More descriptive schemas increase context window size; Smaller models get biased to overuse tools with better descriptions; Skills pile on context cost and can shift the problem rather than solve it; The 'minimum viable description' is a moving target as models evolve
- Implications: Ken should audit MCP schemas for vague purpose/activation criteria; Treat schema design as continuous product work, not one-time documentation; Skills are useful for complex workflows but require careful context budgeting
Trust boundaries: consent friction by design across local/CI/internet tiers
- Claims: Auto-connect feature lets agents access the user's live Chrome session; users requested 'remember my choice' to skip consent dialogs; Team refused because removing friction in local dev (tier 1) creates a backdoor when the lethal trifecta (tool access + prompt + automation) converges; Three trust tiers: local dev (human-in-loop, time-bound consent), CI (containers, separate profiles), internet agents (domain allowlists, prompt injection mitigations)
- Evidence: Reference to Simon Willison blog on lethal trifecta (QR code provided); Local dev example: agent gets full profile access, full internet, full automation → consent required every time; CI/internet tiers use data separation (containers, profiles) and sandboxing to reduce blast radius
- Caveats: Friction annoys users and reduces agent autonomy; explicit tradeoff of convenience for security; Tier model may not fit all architectures (e.g., hosted agents, multi-tenant systems); Prompt injection mitigations are mentioned but not detailed
- Implications: Ken should design consent flows assuming agents will be compromised via prompt injection; Never auto-grant access across trust boundaries, even if users request it; Tier the security model by environment (local/CI/internet), not by tool capability
Notable Concepts & Terms
- tokens per successful outcome: Chrome DevTools team's metric balancing task completion (effectiveness) against token/time/call cost (efficiency); must be tracked per user journey, not globally; analogous to fuel efficiency in that it's worthless if you can't reach the destination
- slim mode: Ultra-minimal tool exposure (3 tools: select page, navigate, evaluate script) to minimize token burn; trades capability (e.g., no network request access) for context window efficiency; design choice, not a temporary state
- proactive detours: Steering agents away from tools they're biased toward due to training data (e.g., away from Lighthouse audit toward performance trace); overrides model training to improve outcomes
- minimum viable description: Schema design philosophy: include purpose (core function) and usage guidelines (activation criteria) to enable tool discoverability without bloating context window; ongoing optimization as models evolve
- lethal trifecta: From Simon Willison: convergence of tool access + natural-language prompt + automation that creates backdoor risk; Chrome DevTools team designed consent friction to prevent this in local dev environments
- trust tiers (local/CI/internet): Three-tier security model: tier 1 (local dev) requires human consent every time, tier 2 (CI) uses containers + separate profiles, tier 3 (internet agents) needs domain allowlists + prompt injection mitigations; tools may be shared but security models must not be
- semantic summaries: Human-legible, markdown-formatted data distillations replacing raw JSON dumps; example: performance trace becomes LCP/INP/CLS metrics instead of 50,000-line trace file; enables agents to 'read the right sentence instead of the entire book'
- dump zone: Reference to Matt's talk (previous session); state where agent is overwhelmed by data volume and fails to reason; Chrome DevTools initially hit this with raw trace files
Operator Notes / Why Ken Should Care
- Ken should apply tokens-per-successful-outcome measurement to any agent tooling before optimizing schemas; it's the only named metric that balances cost and completion, though instrumentation is non-trivial.
- Chrome DevTools validated these patterns across Gemini CLI, Claude Code, and other MCP clients, so the lessons generalize beyond Google's stack.
- The slim/full mode tradeoff is actionable: Ken can offer multiple deployment profiles for different token budgets rather than one-size-fits-all.
- Error messages as agent UX is underrated; self-healing via actionable errors reduces support burden and token waste from retries.
- Trust boundary lesson is critical for agent tooling: consent friction is a feature, not a bug, especially in local dev where prompt injection meets full system access.
- The '97% of MCP tool descriptions have quality smells' paper is worth tracking down (not named in transcript); schema quality directly affects agent success rates.
- CLI post-processing interfaces are a token-saving hack Ken should consider for any data-heavy tools; piping outputs reduces model processing load.
- Proactive detours are a lever for correcting model biases without retraining; useful when you know the model is systematically choosing the wrong tool.
- The tradeoff between tool proliferation and discoverability is unresolved and model-dependent; Ken should expect continuous schema tuning rather than a stable endpoint.
- Hablich is open to hallway-track conversations and LinkedIn connections; Ken can follow up on MCP server design, browser automation, or metrics instrumentation.
Watch Map
- 00:00: Intro: show of hands on MCP usage, deployment; preview of four engineering lessons from Chrome DevTools team
- 01:30: Demo: Gemini CLI + MCP server opening Chrome, running performance trace, analyzing, fixing, validating speed improvement
- 03:00: Context: Chrome DevTools for humans (millions of users, visual UI) vs. Chrome DevTools for Agents (text-based MCP server)
- 03:45: Mistake: throwing 50,000-line trace JSON at agents → context window explosion, dump zone failure
- 04:30: Fix: semantic summaries (markdown, key metrics) instead of raw data → agents can 'read the sentence, not the book'
- 05:20: Agents as a user segment: same intent as humans, different cognitive bottlenecks (token burn vs. visual complexity)
- 06:00: Four engineering concerns: token burn rate, error recovery, tool discoverability, trust boundaries
- 07:20: Tokens per successful outcome metric: balances effectiveness + efficiency, must track per user journey, not globally; bar chart example
- 09:00: Three token burn solutions: tool categorization (hide niche tools), slim mode (3 tools only), CLI post-processing
- 10:00: Error recovery spectrum: actionable messages enable self-healing, proactive detours correct training biases, diagnostic playbooks fix setup issues
- 12:30: Tool discoverability: decomposed monolithic tool → 25 tools → context bloat → minimum viable descriptions + activation criteria
- 13:20: 97% of MCP tool descriptions have quality smells; schema is the UI for agents; example: performance.trace lists LCP/INP/CLS for activation
- 14:30: Skills supercharge workflows but add context cost; tradeoff between capability and token burn is ongoing
- 15:45: Trust boundaries: auto-connect feature, user request to 'remember my choice' rejected; consent friction is security by design
- 16:30: Lethal trifecta (Simon Willison blog); three trust tiers: local dev (human consent every time), CI (containers), internet (domain allowlists + prompt injection mitigations)
- 18:00: Wrap-up: agents are a user segment with non-functional requirements; four takeaways (measure fuel efficiency, turn errors into playbooks, outer descriptions for intent, never compromise trust for convenience)
- 18:30: Q&A and hallway track invitation; LinkedIn QR code
Source/Metadata
- Title: Building Agent Interfaces: Lessons from Chrome DevTools (MCP) for Agents — Michael Hablich, Google
- Transcript words: 3742
- Duration seconds: 1358
- Timestamp note: Timestamps inferred from 1358-second video duration and transcript structure; not explicitly present in transcript but estimated from content flow
Transcript
Let's get started in an interest of time, right? So, hi, welcome. Let's talk about building agent interfaces today. So, let me start with a question first. Who in here is already using MCP servers or CLI tools on your agent? Okay, everybody. That is unsurprising, to be honest. Who in here have already built MCP servers and deployed them for effect? Okay, it's approximately half of the people. Well, today I'm going to share four engineering lessons from the Chrome DevTools team on how we build Chrome DevTools for agents and how we deployed it for effect. Quick context setting. Chrome DevTools for humans is used by millions of web developers on a daily basis to debug web pages. It's directly built into Chrome and developers use it to debug web pages, find errors, audit it, performance profile it, and so on. Right. So, now let's talk a little bit more about Chrome DevTools for agents. So, this is a purpose-built Chrome DevTools, but for agents, how surprising. Yeah, let me briefly show you how it works. So, you can see on the left side, Gemini CLI and the prompt is being entered. And now Gemini CLI has the MCP server being configured and it opens Chrome on the right side. And then does debugging. I think, yes, this is about performance tracing. So, it does a performance trace, analyzes the trace that comes back, go to the performance inside, acts on it, and then makes the web page faster, validate that it's actually faster afterwards, and it's done. You should be done now. It's nearly done. Sorry, it's a video. Whatever. What I wanted to tell you is this is going to work in any MCP client and agent harness that is MCP capable. Doesn't really matter. That was Gemini CLI. Also works in Cloud Code, Codex, OpenClaw, doesn't matter. If you want to have more information, go to this QR code, because that QR code is going to bring you to a web page, and that's going to tell you everything about how you can install it configured for your agent harness. Question again. Who in here has already tried it out? Okay, so 10%. Thank you. I love you. I also love everybody else, but I love the others more. So, I was rude. I didn't introduce myself. My name is Michael Hablich. I am the product manager for Chrome developer tools at Google, and I'm also a guest director at the university nearby where I'm living. I have 20 years of experience in tech, developer, tester, QA engineer, project manager, product manager, program manager, and so on. If you have questions afterwards, please talk with me in the hallway track or connect with me over LinkedIn. The QR code will bring you to my LinkedIn page. Both is fine. Please do that. I would be super interested to talk with you about MCP servers, browser automation tools, and stuff like that. Okay, about now, enough advertisement. Let's move on. We ship Chrome DevTools because we saw that coding agents were flying blind one and a half years ago. They worked very good with generating code, but they were not able to validate what they actually were doing, right? And that just sucked, but we assumed they are going to be fine if we throw a lot of data at them. Because, they are machines, right? The thing is, we were wrong. So this is the head of a trace file. A trace file has all the data about the performance profile. And this is a file, multiple megabytes of data, and this is 50,000 lines of JSON. And we did throw that against common agent harnesses at that point, one and a half years ago, something like that. And without surprise, this is too much data for an agent, for a model to actually reason about. And it blew through the context window. And if you have seen Matt's talk about the dump zone, you're moving the agent into the dump zone at that point. So I thought, okay, we built it wrong. That's not going to work. We need to do something else. So in that case, for example, what we did, our performance tracing endpoints, it can also return that for post-processing with other tools. But what it's really doing is, it's returning markdown now, and semantic summaries. Like, this is an example of such a semantic summary, which just gives you information about typical performance metrics, like largest content for paint, IMP, and so on. I'm not going to bore you about all the performance metrics. And we are going to talk about them anyway, because they're a very good example of how this is working. Well, essentially, we didn't force the agent to read the entire book, the trace, but instead we just pointed it at the right sentence, and this is the semantic summary. And that works quite well. In the end, or in the beginning, agents are a different user class. So that's where it clicked for me, yes, they are a separate user segment. So how do we reason about that? The thing is, agents and humans, they share the intent, they share the goal, right? In our case, for example, both want to identify errors on a page and want to fix those errors. But they think differently. They have different cognitive bottlenecks, more or less. For humans, it's a lot about visual complexity. So humans are very, typically very visual creatures. And we need layout, we need color in order to find the signal. And this might not be the best example for an appealing UI, but this is just our console interface where console errors are being surfaced, and we can also use it as a wrapper interface on Chrome DevTools for humans. But if you know where to look, you can use it to identify errors on the page very easily. LMMs, on the other hand, they prefer, unsurprisingly, non-visual interfaces, right? They care about schema clarity, data density. So on the right side, you see a schema for, I think it's for the performance endpoints that we just discussed earlier. Yeah, and they really like that. It's a textual, non-visual interface, right? Whatever. This is now a long way of saying, designing for agents actually requires a few engineering concerns. I'm going to talk about today. So there's token burn rates, there's error recovery, there's tool discoverability, and there's also trust boundaries. And I'm going to cover them today, very shallow. Let's talk in the hallway track more. Let's start with token burn rate. Tokens are a cognitive load for agents, right? Very similar to humans remembering clicks, the right clicks on a visual interface. The thing is, most APIs today, they're very often a 14-step checkout flow, as you can see on the left side, for example, for a human. Or the trace that I showed you before. I'm going to talk about today. So there's token burn rates, there's error recovery, there's tool discoverability, and there's also trust boundaries. And I'm going to cover them today, very shallow. Let's talk in the hallway track more. Let's start with token burn rate. Tokens are a cognitive load for agents, right? Very similar to humans remembering clicks, the right clicks on a visual interface. The thing is, most APIs today, they're very often a 14-step checkout flow, as you can see on the left side, for example, for a human. Or the trace that I showed you before. That sucks because every word that is sent back to the model is metered. It costs money, right? Every word, every output token, input token that it gets costs your money. Every reason that's happening costs you money. And that translates to monetary cost. So how can we reduce that? Well, let me introduce a metric. Of course, let's talk about metrics. And that is called tokens per successful outcome. What it does, it balances effectiveness and efficiency. Sounds very hypey. And maybe it is. I don't know. What is it about? So effectiveness is about does the agent complete the entire user journey? Is the functional intent actually fulfilled? Yes or no? And then there's efficiency, which unsurprisingly is about token cost, tool calls, duration. In the end, what tokens per successful outcome tell you is the fuel efficiency of your interface, right? And there's a caveat because there's always a caveat. Fuel efficiency is relatively worthless if you can't reach your destination. So that's why it's called tokens per successful outcome and not tokens per outcome. So make sure that you actually also measure effectiveness, right? And there's one more caveat. And this is, you can't measure that globally. I mean, you can do that, but it's going to be tremendously different between different user journeys and task classes. So don't compare them globally. Compare them within your user journey that they're measuring. And what I mean with that is, for example, in Chrome DevTools, we have the user journey of web scraping, right? So an agent going to a website and extracting information. That's relatively cheap. But there's also user journeys that are more intricate, like debugging a website, finding out why the responsive layout is not working. That thing is going to use more tokens, but that is fine because it's a much more intricate and more interactive session that's happening. Okay, how does this look in real life? This is what it looks like in practice for a project, an eternal project that we are working on. And you see a lot of neon bars, which is great. I like neon bars. But I am not going to worry about details. The important thing is the neon bars on the left side, the longer the bar, the more effective a tool, right? The shorter the bar, the less effective a tool for a particular use case. So each of those bars on the left side are about use cases. Which means the smaller bars are probably the ones that we should be focusing on next, how to improve that, how to improve the tokens per successful outcome there. Yeah. As you might have already guessed, measuring tokens per successful outcome is not straightforward. The thing is, but even an imperfect measurement is better than simply doing gut-driven decisions. And with that, at least you can do data-informed decisions. Right. In DevTools for Agents, we are addressing token burn from three different angles. First, there's tool categorization. So very straightforward. We hide niche tools. We hide command line parameters. For example, we have tools for Chrome extension debugging. And not everybody is developing Chrome extensions. So why add it to the default context window? There's no point in doing that. Then there's a slim mode. And this one is fun. So what slim mode is doing is pushing tool categorization to its limits. It's only exposing, I think, three different tools. Select page, navigate page, and evaluate script. And this is great for your context window. But there's a trade-off. I'm going to talk a lot about trade-offs today. There's a trade-off because the less tools you expose, the less tools you also have at disposal for your agent, which means your agent might do extra turns to achieve the same goal. It might not actually have the right tools at its disposal to do something. For example, getting network requests. You can't do that with a valid script. And stuff like that. Yeah, and there's also a command line interface that we are offering. You have seen in the previous talk maybe about a code mode and all that stuff. We also support that. So it is an MCP server, yes. But there's also a command line interface for the same thing, giving them nearly the same functionality. What it enables you, you can have your agent chain commands together to do post-processing. In this example, I don't think you can see it. The accessibility tree is extracted with a grab command, and then the result, the ID of the control is being piped into a click command. And that is, of course, saving a lot of tokens doing that, because the model doesn't need to process all the tokens. The post-processing is happening on your computer. Right. Efficiency is useless if your agent gets stuck. So that brings us to error recovery. And, yeah, because every time your agent encounters an error, it's going to cost your tokens because it needs to retry, it needs to understand what is happening and stuff like that. And that just sucks. Now, yeah. Error recovery is a spectrum. And let's talk a little bit about that, what we are doing here. So first, of course, you should add useful error messages. That sounds obvious. For a lot of tools, it isn't. And it was also not obvious for all the tools that we are actually offering. So we also did a few iterations on them to actually make the error messages good. For example, It's going to cost your tokens because it needs to retry. It needs to understand what is happening. And that just sucks. Error recovery is a spectrum. Let's talk a little bit about that, what we are doing here. So first, of course, you should add useful error messages. That sounds obvious. For a lot of tools, it isn't. And it was also not obvious for all the tools that we are actually offered. So we also did a few iterations on them to actually make the error messages good. Here, for example, an unable to navigate back in a selected page for a particular tool, history entry to navigate was not found. We actually added the last sentence. And that enabled the agent to self-heal, which is super useful, because then the agent doesn't need a human to actually fix the problem, but the agent can self-fix the problems. Then there's proactive detours. So beneath each of the agents, there's a model, and the model is being trained on certain data. And sometimes there are things where you want to contact the training data. And that's what you can do with proactive detours. In this example, we detour the agent for performance profiling to our start performance trace tool and not to the lightest audit. And there's diagnostic playbooks. So we also offer skills, of course. And we have a skill that's called troubleshooting. And we see a lot of people have problems setting up the Chrome DevTools MCP server correctly. And that troubleshooting skill is then going to kick in and help the human and the agent to fix the setup issues. Again, enabling self-healing of the agent. And all of this increases the resilience of your product, of the agent harness that you're building. And this is nice and helps you with standing mistakes. And now let's talk about this credibility, which is about actually preventing them. So our initial design had one monolithic tool called debug web page. So we all had one tool, debug web page. And another agent could send a prompt there and tell it, hey, debug this web page. There is some responsive layout that's not working. And it was neat from an engineering perspective, but it didn't really work. So we decomposed it into 25 different tools. And we thought, problem solved. Of course it wasn't. Because we traded that problem off to another. And that was, agents now had 25 tools at the disposal. How are we going to find out which one to use when? Well, let's talk about that. According to this paper here, 97% of MCP tool descriptions have quality smells. And this matters because the schema is the UI for the agent. So let's make the UI better. And fixing this is a trade-off. As I said, it's always a trade-off. Because, of course, you can make the descriptions better. And that's going to increase your context window size. So you probably don't want to have that. Or maybe you want. And also, smaller models in particular are not that good with more descriptions because they get biased in using tools they shouldn't be using in the first place. This is a trade-off space. Read the paper. Super interesting. But there are a few things you actually should be doing. They're relatively uncontroversial. And that is, define purpose. Can you explain what the tool call function is? Is this working? Ah, yes. Here it is. Yes. Okay. Explain the tool's core function. And there's usage guidelines, provide clear activation criteria. And how this looks like in Chrome DevTools for agents, for example. And performance.trace tool. What we have in there as a description is used to find performance, front-end performance issues and core web metrics, LCP, INP, CLS. Why is this relevant? LCP, INP, CLS are web performance metrics. And an agent is able to make the connection, oh, I'm going to use that tool if I need to improve page load, for example. We have far from finished optimizing that because models and agent harnesses also keep on changing all the time. So it's an endless quest for minimum viable description. But it is what it is. You can supercharge all of that with skills. As I said, we also have skills. And that is great. In particular, if you have more intricate workflows. But, again, there's a trade-off. They are not free lunch. If you pile in too many skills, you're going to shift the problem and run into the same problem again. Agents are going to call your skills even if you shouldn't be calling them. Your context window size is going to increase and all that stuff. The trade-off is shifting. It's not disappearing. Okay, now we have optimized for cost, recovery, and discovery. Let's now talk a little bit about trust because you don't want to have a backdoor in the system. Chrome DevTools for Agents has a feature called Auto Connect. And it's a feature that lets you as a human, using your coding agent like Cloud Code, share the stream with the agent. Hey, I'm stuck here. Please help me debug that and fix the problem that I'm seeing here. Amazing feature. I really like it. And users, of course, requested a feature. Hey, why do I need to click allow all the time? I don't want to do that. Please remember my choice. And in a traditional user experience design, that would have been a clear win, right? Because it's just friction that you want to remove. In a world where you are delegating away work to agents and automating away agents, you need to think about trust boundaries. And so that's why we actually designed it so that friction is actually by design because we didn't want to have that. And why? Let's talk about that. There's a blog post from Simon Willison about the lethal trifecta. QR code. You should read it. It's great. I don't want to do that. Please remember my choice. And in a traditional user experience design, that would have been a clear win, right? Because it's just friction that you want to remove. In a world where you are delegating away work to agents and automating away agents, you need to think about trust boundaries. And so that's why we actually designed it with so that friction is actually by design because we didn't want to have that. And why? Let's talk about that. There's a blog post from Simon Willison about the lethal trifecta. QR code. You should read it. It's great. I'm not going to talk more about that. And utilizing that. There's at least three tiers that I'm thinking about in browsing agents. You have tier one, and that's the local development environment. In a local development environment, you have the human in a loop. And the human wants to grant access to the default Chrome profile, to the data that you already have access to, to the agent in a time bound manner. And then you have tier two. And tier two is agents running in a continuous integration environment. So it's controlled environments, but they're separated away. At that point, you should be using data separation things like containers, of course, but also other things like separate Chrome profiles and stuff like that. If you want to connect to them, we also have a mechanism for that, and that is called a remote debugging port. And first, there's agents with full internet access, and that is YOLO mode, essentially, because every webpage out there is able to do some prompt injection text to your agent. So make sure that it's do the same thing as in tier two, but also in tier three, make sure that if the domain allow lists and prompt injection mitigations, all that stuff together. Going back to the lethal trifecta, that's what we mostly reason about tier one, and that's where all those three things are coming together. So that's why we actually say no, the human actually needs to consent every time. Key point being is a local agent, tier one, and the browsing agent fleet, tier three, your research agents maybe, might share a tool like Chrome DevTools for Agents, but they should share nothing else about your security model that you're having, right? Okay, let me wrap that up. User experience is evolving to incorporate agent experience. An agent is just another type of user, segment of user, also with non-functional requirements. Efficiency, discoverability, security, stability, and so on. I shared four takeaways from Chrome DevTools for Agents. When we are implementing that, that is measure fuel efficiency of the interface with tokens for successful outcome, turn errors into recovery playbooks, outer descriptions for intent, and never compromise trust for convenience. Agents are our next users. Let's help them help us. And with that, I wish you a nice remaining conference. Thank you. Thank you. Thank you. Agents are our next users. Let's help them help us. And with that, I wish you a nice remaining conference. Thank you. Thank you. Thank you.