Stop Evaluating Models Like It's the 50s - Alejandro Vidal, Mindmakers
Description
Psychologists spent the last century learning how to measure something invisible and uncooperative: a human mind. AI evaluation, meanwhile, still scores like it is 1950. Count the right answers, treat every question as equal, trust the percentage (this is Classical Test Theory). We are sitting on decades of measurement theory built for exactly this problem, and we forgot to use it. Borrow it and the picture changes. Item Response Theory (or IRT, the math behind the SAT and the GRE) models every item on top of a shared scale with real error bars. That tells you which of your test items are pure noise, which are optimal, and where the knowledge gaps and unexpected behaviours are. Adaptive testing then measures the same ability with a fraction of the questions, which means private, rotating benchmarks that resist contamination instead of saturating in a month (tinyBenchmarks already hinted you can shrink a benchmark with IRT). It goes further than scoring. The statistical properties of how a model fits the test reveal something a single number never could: data leakage, the moment an agent has quietly seen the answers before. The same machinery that catches a cheating student catches a contaminated benchmark. And instead of one flat score, you get a shape: where the jagged frontier actually is, which abilities are solid and which are luck, so you know which direction to push next. You will leave this talk with a way to build evals that are cheaper, harder to game, and that tell you what your model actually learned instead of how lucky it got. This is not about handing human tests to a model. It is about borrowing a century of how to measure a mind that does not want to be measured. Speakers: - Alejandro Vidal (Mindmakers): Alex Vidal is the founder of Mindmakers, a psychologist and computer scientist who teaches humans to use AI and teaches AIs to teach humans, building adaptive learning technology and the agents, evals and boring infrastructure that keep it from f
Summary
Generated by claude-sonnet-4-5At-a-Glance
- Verdict: Watch fully
- Core thesis: Replace classical test theory (counting right answers) with Item Response Theory (IRT) from psychometrics to calibrate question difficulty, measure model intelligence probabilistically, detect benchmark contamination, reduce evaluation costs 5x, and fingerprint model relationships.
- Why it matters: Current LLM benchmarking assumes all questions are equally important; IRT reveals which questions actually measure intelligence, exposes mislabeled items, detects training contamination, and cuts evaluation token costs by 80% while preserving ranking accuracy.
- Best use: Implement IRT-based benchmark auditing for proprietary evals; use adaptive testing to protect valuable benchmarks from contamination; apply residual analysis to detect distillations and inference platform bugs.
Executive Summary
Alejandro Vidal argues the LLM industry is stuck in "classical test theory" (counting right answers), a 1950s-era approach that treats all questions as equally important. He demonstrates how Item Response Theory (IRT)—the psychometric framework underlying modern IQ tests—provides calibrated difficulty scores (B parameter) and discrimination scores (A parameter) for each question, plus probabilistic intelligence estimates (theta) for each model with confidence intervals. Using real data from epoch.ai benchmarks, he shows that two models with nearly identical raw scores (Claude Opus 4.1 at 245/337 vs Gemini 3 Pro at 247/337) are actually separated by nearly one standard deviation in theta when properly calibrated, revealing Gemini as significantly more intelligent.
The talk presents six practical applications: (1) Benchmark auditing—automatically flag mislabeled or negatively-correlated questions by examining A parameters below zero; (2) Optimal benchmark sizing—reduce from 484 to 97 questions (5x compression) while maintaining 99% ranking correlation by selecting high-discrimination items; (3) Outlier detection—use residuals to spot unexpected right/wrong answers that may indicate contamination, overfitting, or inference platform bugs; (4) Adaptive testing—protect proprietary benchmarks by using anchor sets plus organization-specific "fingerprint" questions to detect if models trained on leaked items; (5) Differential item functioning—identify questions biased toward open-weight vs closed-weight models to understand training differences; (6) Model genealogy—correlate residual patterns to detect distillations (0.38 correlation), same-base models, and version evolution.
Vidal emphasizes this is "very basic math" borrowed from 70+ years of psychometric research, yet transforms benchmark interpretation. GPQA is cited as an exceptionally well-designed benchmark where every item is highly discriminative and non-overlapping, so random sampling works—but most benchmarks have redundant or low-signal questions. He notes IRT enables merging multiple benchmarks (referencing the "meta benchmark" paper), measuring multidimensional skills, incorporating latency/token signals, and potentially measuring alignment. The approach requires fitting IRT models to response matrices (models × questions), then analyzing item curves and residuals.
Key Takeaways
- Claim: Classical test theory assumes all questions are equally important, which is insane—better questions should weigh more. | Evidence: Example comparison: Claude Opus 4.1 scores 245/337 (72.7%) vs Gemini 3 Pro 247/337 (73.3%)—only 2-point difference—but IRT reveals Gemini's theta is nearly one full standard deviation higher because it answers significantly harder questions. | Caveat: IRT requires sufficient data (multiple models × multiple questions) to calibrate item parameters; single-model evaluation cannot use this method. | Implication: Ken's evaluation systems should stop using raw accuracy as primary metric; implement IRT calibration to get true intelligence rankings and avoid misjudging models that happen to answer easy vs hard questions. | Timestamp: 01:35
- Claim: IRT can detect mislabeled benchmark questions automatically by flagging negative discrimination (A < 0), where better models get the answer wrong. | Evidence: Two examples shown: (1) a question with incorrect gold answer where ChatGPT confirmed the benchmark was wrong; (2) a question asking 'total passengers' but gold answer included crew (583 total deaths vs 583 passengers), which better models correctly distinguished. | Caveat: Negative A parameters can also indicate legitimate trick questions or distribution shift, not always errors; requires human review of flagged items. | Implication: Ken should audit proprietary benchmarks using IRT discrimination analysis before trusting results; this catches subtle labeling errors humans miss and improves benchmark quality over time. | Timestamp: 08:42
- Claim: You can reduce benchmark size by 5x (484→97 questions) while maintaining 99% ranking correlation by selecting high-discrimination items. | Evidence: Real benchmark data shows selecting items by highest A parameter achieves 99% correlation with full benchmark ranking using only 20% of questions; random sampling performs far worse and requires more questions to reach same correlation. | Caveat: This does NOT work on every benchmark—GPQA is so well-designed that random sampling works equally well because all items are highly discriminative and non-overlapping; most benchmarks have redundant or low-signal items. | Implication: Ken can slash evaluation costs (tokens/time/money) by 80% on most benchmarks without sacrificing ranking quality; prioritize running full benchmarks once to calibrate, then use optimized subsets for routine eval. | Timestamp: 12:18
- Claim: Adaptive testing with anchor sets + organization-specific 'fingerprint' questions can detect benchmark contamination by examining residuals for suspiciously good performance on leaked items. | Evidence: Synthetic example shows one organization's models have average residuals 'extremely unlikely' on their fingerprint set—much larger than other orgs—indicating possible training on those specific questions; uses hard questions to maximize signal. | Caveat: Not bulletproof—could have false positives from lucky sampling or coincidental skill match; requires longitudinal data (multiple model releases) to establish patterns. | Implication: Ken should implement fingerprinting for valuable proprietary benchmarks: use public anchor set + private per-customer question sets, then monitor residuals across model versions to protect IP and detect contamination early. | Timestamp: 18:30
- Claim: Residual analysis reveals model inconsistency that can indicate inference platform bugs, quantization errors, or contamination—o4-mini showed the least consistent behavior. | Evidence: Matrix visualization shows o4-mini has many unexpected red (wrong) and green (right) answers in the middle difficulty range where behavior should be consistent; properly functioning models should have predictable success/failure patterns based on theta. | Caveat: Some noise is expected; interpretation requires domain knowledge to distinguish random variance from systematic issues; single outliers mean little, but patterns matter. | Implication: Ken's agent systems should track residual patterns as a model health check—unexpected residuals on routine questions may indicate inference platform degradation, quantization issues, or prompt contamination before they cause visible failures. | Timestamp: 16:45
- Claim: Model genealogy via residual correlation can detect distillations (r=0.38), same-base models, different versions, and training relationships without access to model internals. | Evidence: Correlation matrix and projection show clusters: same-lab models (different versions), DeepSeek distillations, Qwen variants all group together; shared training history produces similar error patterns; Llama and Gemini version progressions visible. | Caveat: This is the most speculative application—correlations are moderate (0.38 for same-base), not definitive proof; requires interpretation and may have false positives from coincidental skill overlap. | Implication: Ken could use residual fingerprinting to detect unauthorized distillations of proprietary models, understand competitive model relationships, or verify vendor claims about model lineage—opens forensic analysis of model provenance. | Timestamp: 22:15
Detailed Brief
Core IRT Framework vs Classical Test Theory
- Claims: Classical test theory = counting right answers, assumes equal question importance; IRT models each question with difficulty (B) and discrimination (A) parameters; Each question gets an item response curve mapping model intelligence (theta) to probability of correct answer; B parameter = difficulty where 50% success probability; distributed normally so B=0 is average difficulty; Theta (model intelligence) also normally distributed, enabling interpretable comparisons; Theta estimation combines likelihoods from all item response curves, yielding confidence intervals
- Evidence: Real epoch.ai benchmark data with 337 questions across models like GPT-4, Claude, Gemini; Example: GPT-4 theta=1.2, question B=-1.2 → 99% success probability; Claude Opus 4.1: 245/337 raw vs Gemini 3 Pro: 247/337 raw, but theta differs by ~1 SD; Likelihood interval visualization shows distribution narrowing as more questions added; Item curves visualized with easy questions (steep early curves) vs hard questions (steep late curves)
- Caveats: Requires sufficient data: multiple models × multiple questions to fit parameters; Normal distribution assumption may not hold for all benchmarks or skill domains; Shared scale (theta-B) only meaningful within a calibrated benchmark set; Single-model evaluation cannot use IRT; needs comparative dataset
- Implications: Ken's eval infrastructure should store item-level responses, not just aggregate scores; Implement IRT fitting pipeline (likely using existing psychometric R/Python libraries); Report theta + confidence intervals instead of raw accuracy for model comparisons; Calibrated benchmarks become reusable reference scales, not just one-time rankings
Benchmark Auditing: Finding Bad Questions
- Claims: Discrimination parameter A reveals question quality: high A = informative, A≈0 = noisy, A<0 = problematic; Negative A means better models get the question wrong—indicates mislabeling or contamination; Can automatically flag questions with A significantly below zero; LLMs can then review flagged questions to identify specific errors
- Evidence: Example 1: Question with unknown answer, ChatGPT confirmed gold answer was wrong; Example 2: 'Total passengers' question—gold answer 583 included crew, but question specified passengers only; better models distinguished correctly; Both examples had negative discrimination—smarter models failed them; Most common issue is mislabeling, but some items are just poorly designed
- Caveats: Not all negative A items are errors—could be legitimate trick questions or edge cases; Requires human judgment on flagged items; automated detection only surfaces candidates; Small sample sizes can produce unstable A estimates
- Implications: Ken should run IRT audit on all proprietary benchmarks before trusting them; Implement automated flagging + human review workflow for benchmark maintenance; This catches subtle errors (like passengers vs total deaths) that survive manual review; Improves benchmark quality over time, making results more reliable
Optimal Benchmark Sizing and Cost Reduction
- Claims: Can reduce benchmark from 484→97 questions (5x) while maintaining 99% ranking correlation; Method: select items with highest discrimination (A) parameter first; Random sampling performs far worse, requiring more questions for same correlation; Savings: ~80% reduction in tokens/time/cost for routine evaluation; Not universal: GPQA is so well-designed that random sampling works equally well
- Evidence: Real benchmark comparison: discrimination-based selection reaches 99% correlation at ~97 items vs 484 original; Random selection shown to have much worse correlation curve; GPQA counterexample: every item highly discriminative and non-overlapping, so all items useful; Many benchmarks have redundant items with overlapping curves
- Caveats: Requires initial full benchmark run to calibrate item parameters; Only works after IRT fitting; can't predict optimal subset without calibration data; GPQA-style benchmarks (rare, well-designed) don't benefit from this technique; Removing low-A items permanently loses some signal; better to weight them less in adaptive testing
- Implications: Ken should run full benchmarks once per model family to establish IRT parameters; Then use optimized subsets for rapid iteration, A/B testing, or frequent monitoring; This makes expensive benchmarks (long, GPT-4-judged, etc.) economically viable for routine use; Can test more models, more often, within same budget
Contamination Detection via Adaptive Testing and Residuals
- Claims: Adaptive testing protects benchmarks: anchor set (public, consistent) + fingerprint sets (org-specific, hard questions); Fingerprint questions are deliberately hard and unique per organization; Monitor residuals (observed - expected performance) on fingerprint questions across model releases; Suspiciously low residuals = possible training on leaked questions; Residuals also detect overfitting, inference platform bugs, quantization errors
- Evidence: Synthetic dataset example: one org's average residuals on their fingerprint set are 'extremely unlikely' vs others; DeepSeek R1 example: unexpected right answer on hard question → positive residual outlier; o4-mini example: inconsistent behavior (many mid-difficulty outliers) suggests inference issues; Matrix visualization shows expected vs actual answer patterns
- Caveats: Not bulletproof—could have false positives from lucky sampling or legitimate skill improvement; Requires longitudinal data (multiple releases) to establish contamination patterns; Single outliers are noise; need systematic patterns to conclude contamination; Inference bugs vs contamination require contextual interpretation
- Implications: Ken should implement fingerprinting for any proprietary benchmark with competitive value; Track residuals per customer/model-family as early warning system for contamination; Use residual monitoring as health check for agent inference platforms; This protects benchmark IP and ensures fair evaluation over time
Differential Item Functioning and Model Bias
- Claims: Can split models into groups (open-weight vs closed-weight) and fit separate item curves per group; Unbiased items have overlapping curves; biased items show gap between groups; Measures whether certain questions systematically favor one model type; Can reveal training differences: some questions favor open-weight models, others closed-weight
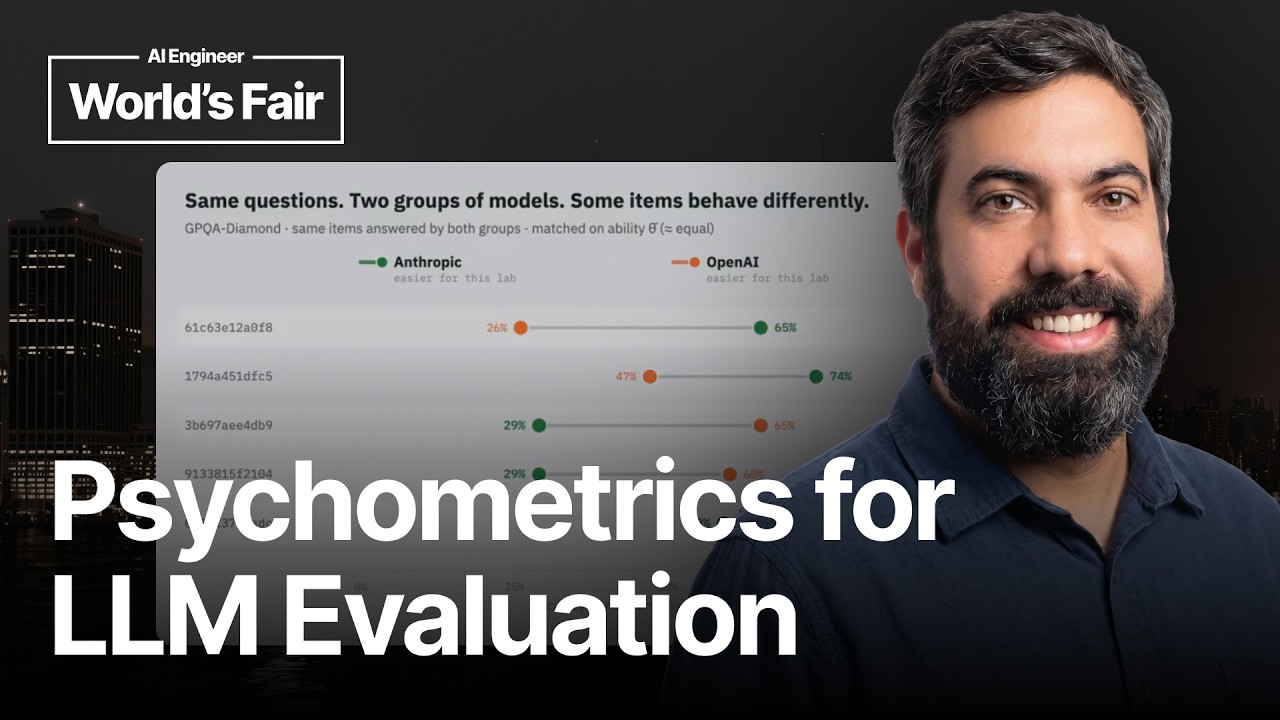
- Evidence: Real benchmark analysis found items biased toward open-weight and toward closed-weight models; Gap calculation between curves identifies magnitude of bias; Items with common patterns (not disclosed to avoid leakage) cluster by model type; Technique borrowed from psychology to detect test bias against demographic groups
- Caveats: Speaker doesn't reveal specific biased items to avoid benchmark contamination; Cannot always pinpoint root cause (training data? architecture? RLHF?); Group definitions (open vs closed) are coarse; more granular splits might reveal different patterns; Bias ≠ invalidity; could reflect legitimate capability differences
- Implications: Ken can use DIF analysis to understand which capabilities open-source models systematically lack vs closed; Helps target training data or fine-tuning for open-weight models to address gaps; Can detect if benchmarks systematically favor certain model families, affecting leaderboard fairness; Reveals implicit assumptions about 'intelligence' encoded in benchmark design
Model Genealogy via Residual Fingerprinting
- Claims: Models with shared training history produce correlated residual patterns (similar errors); Correlation matrix + projection reveals clusters: same lab, same base, distillations, version progression; Can detect: same-base models (r=0.38), distillations, different effort levels, version evolution; Opens forensic analysis of model relationships without internal access
- Evidence: Visualization shows DeepSeek distillations cluster together, Qwen variants cluster, same-lab models cluster; Llama version progression visible in projection space; Gemini versions also show evolution pattern; Same-base models: 0.38 correlation example given
- Caveats: Most speculative application—correlations are moderate, not definitive proof; Could have false positives from coincidental skill overlap vs actual shared lineage; Requires careful interpretation and domain knowledge; Not as immediately practical as auditing or cost reduction
- Implications: Ken could detect unauthorized distillations of proprietary models by residual comparison; Verify vendor claims about model origins or training procedures; Competitive intelligence: understand which models share training data or architectures; Potential for model provenance verification if industry adopts this as standard
Future Research Directions
- Claims: Multidimensionality and hierarchical models: measure different skill dimensions (coding, reasoning, etc.) separately; Merge different benchmarks to improve estimation via shared IRT scale; Add latency, token count, or other signals as additional parameters correlated with intelligence; Use IRT for alignment measurement, potentially combined with mechanistic interpretability
- Evidence: Multidimensional IRT is established in psychometrics for measuring distinct cognitive abilities; Meta benchmark paper (referenced) already demonstrates benchmark merging; Latency/tokens are measurable, potentially informative signals; Vidal is actively working on all these areas
- Caveats: These are proposed future directions, not validated applications yet; Multidimensional models require more data and careful interpretation; Alignment measurement via IRT is speculative; unclear how to define 'alignment intelligence'; Mechanistic interpretability + psychometrics integration is uncharted territory
- Implications: Ken should monitor psychometric LLM research for production-ready implementations of these techniques; Multidimensional IRT could replace current practice of running separate benchmarks per domain; Benchmark merging could create universal intelligence scales across multiple eval suites; Alignment + IRT could provide quantitative, comparable alignment scores vs current vibes-based assessment
Notable Concepts & Terms
- Item Response Theory (IRT): Psychometric framework that models each test item with difficulty (B) and discrimination (A) parameters, estimates test-taker ability (theta) probabilistically with confidence intervals; evolution of classical test theory used in modern IQ tests
- Classical Test Theory: Older psychometric approach (1950s) that counts right answers and treats all questions as equally important; current default in LLM benchmarking; IRT's predecessor
- Theta (θ): Model intelligence parameter in IRT, normally distributed (mean=0, SD=1), represents latent ability; maps to probability of success on any calibrated item via item response curves
- B parameter: Item difficulty in IRT; the theta level at which model has 50% chance of correct answer; normally distributed where B=0 is average difficulty, positive is harder, negative is easier
- A parameter (discrimination): Item discrimination/slope in IRT; measures how well a question separates high vs low intelligence models; high A = steep curve (informative), A≈0 = noisy, A<0 = problematic (better models fail)
- Residuals: Difference between expected (IRT-predicted) and observed model performance on each item; used to detect outliers, contamination, inference bugs, and create model fingerprints
- Adaptive Testing: Strategy to protect benchmarks by using anchor sets (consistent, public) plus fingerprint sets (org-specific, hard questions) to detect contamination via residual analysis over time
- Differential Item Functioning (DIF): Psychometric technique to detect item bias: compares item response curves across groups (e.g. open vs closed-weight models) to find questions that systematically favor one group
- Anchor Set: Fixed subset of benchmark questions shown to all models/organizations in adaptive testing; provides consistent reference for comparison and theta estimation
- Fingerprint Set: Organization-specific subset of hard benchmark questions in adaptive testing; used to detect contamination by monitoring residuals for suspiciously good performance
- GPQA: Graduate-level science Q&A benchmark cited as exceptionally well-designed; all items highly discriminative and non-overlapping, so random sampling works as well as optimized selection
- Epoch.ai: Source of real benchmark datasets used in the talk; provides open datasets for LLM evaluation research
Operator Notes / Why Ken Should Care
- Ken's eval infrastructure currently likely uses raw accuracy (classical test theory). This talk shows IRT provides: (1) true intelligence rankings when raw scores are similar, (2) automatic bad-question detection, (3) 5x cost reduction via optimal question selection, (4) contamination detection, (5) model relationship forensics.
- Immediate action: implement IRT fitting for proprietary benchmarks. Existing Python libraries (e.g. py-irt, mirt) handle the math. Store item-level responses (model × question matrix), fit IRT model, report theta + CI instead of raw accuracy.
- Cost optimization: after initial IRT calibration, can reduce benchmark size ~80% by selecting high-A items. Dramatically lowers token costs for frequent evaluation, A/B testing, or monitoring. Run full benchmark periodically to update calibration.
- Security: adaptive testing with fingerprints protects valuable benchmarks from contamination. Implement anchor + per-customer fingerprint sets, monitor residuals per model release. Early warning system for leaked questions.
- Quality control: use residual analysis as health check for agent inference platforms. Unexpected residuals (especially on o4-mini-style inconsistent patterns) may indicate quantization bugs, prompt contamination, or platform degradation before visible failures.
- Model provenance: residual fingerprinting can detect unauthorized distillations or verify vendor claims about model lineage. Moderate correlation (r=0.38 for same-base) but useful for competitive intelligence or IP protection.
- This is production-ready: Vidal says 'very basic math' and provides code/data. Not experimental research—psychometrics has 70+ years of validation. Gap is awareness, not methodology.
- Future watch: multidimensional IRT (separate skill dimensions), benchmark merging (universal intelligence scale), latency/token signals, alignment measurement. These could replace current patchwork of domain-specific benchmarks.
Watch Map
- 00:00: Introduction: psychology + CS background, borrowing from psychometrics
- 01:35: Core problem: classical test theory (counting right answers) assumes equal question importance
- 03:20: IRT framework: B (difficulty), A (discrimination), theta (intelligence), item response curves
- 05:45: Example: Claude 245 vs Gemini 247 raw scores, but ~1 SD theta difference
- 08:42: Application 1: Benchmark auditing—detect mislabeled questions via negative A
- 10:30: Mislabeling examples: wrong gold answer, passengers vs total deaths
- 12:18: Application 2: Optimal sizing—484→97 questions (5x) at 99% correlation
- 14:25: GPQA counterexample: well-designed benchmark where random sampling works
- 16:45: Application 3: Outlier/residual detection—inference bugs, contamination, o4-mini inconsistency
- 18:30: Application 4: Adaptive testing—anchor sets + fingerprints to detect contamination
- 20:15: Application 5: Differential item functioning—bias toward open vs closed-weight models
- 22:15: Application 6: Model genealogy—residual correlation reveals distillations, same-base (r=0.38), version evolution
- 24:30: Future directions: multidimensionality, benchmark merging, latency/token signals, alignment measurement
- 25:45: Closing: materials and benchmarks available, contact for collaboration
Source/Metadata
- Title: Stop Evaluating Models Like It's the 50s - Alejandro Vidal, Mindmakers
- Transcript words: 5524
- Duration seconds: 1414
- Timestamp note: Timestamps manually estimated from 1414-second video; chapter markers not present in transcript but inferred from content flow
Transcript
Hi everyone, I'm Alejandro Vidal, the founder of Mindmakers, and my background is psychology and computer science, which is unusual, but for today is going to be extremely helpful, because I'm going to show you how you can borrow ideas from psychology and psychometrics to improve the way that you are evaluating models right now. Because at this moment the state in the industry is counting the number of right answers. That actually has a name, it's classical test theory, and we have by far better tools to do that. So it makes sense to borrow ideas from IQ tests and related stuff, so we can apply them to LLMs. Let me start with a very simple example here. We are using real data from epoch.ai. If you don't know them, their project is amazing, and they have quite open datasets so you can actually use them. And here we have a random selection of models with a real benchmark. As you can see here, we have an accuracy for each one of them. That's the current state of the art. So if we split its bar into different questions, each one of them is going to be a different question or a different item. I'm going to use item for the same idea of question. In psychometrics we use item instead of question. If you sum all together, we are using a very strong assumption. We are saying that every question is equally important. They should weigh the same, which is insane if you think about that. We have better questions, more complicated questions, that maybe we should pay more attention to. And also we can have questions that are mislabeled or something like that. So we are going to improve this. What we are going to do is we are going to use each item, its column here is going to be one item, and we are going to treat them as individual variables. So we are going to have this matrix here. As you can see here, on the top right corner, we have difficult questions for weaker models, and on the other side we have very easy questions for strong models. So it makes sense that we observe this pattern. But we are going to estimate for each question, for each item, a difficulty level. That is going to be called B. The B parameter is going to be the difficulty of each one of them. And we are going to create a function for each question. That function maps the LLM intelligence to the probability of getting that answer right. Okay, so very easy items are going to be here, and extremely complicated items are going to be there. As you can see here, B is the point that crosses 50% chance in that curve, which is going to be useful later. Also, B is going to be distributed by a normal distribution, which is going to be also helpful to use that for interpretation. Okay, so with that in mind, we can actually estimate also theta. Theta is going to be the level of intelligence for each model. That's going to be that dot, that black dot. So as you can see on the right side of each dot, mostly all the questions are going to be red, which makes sense. If they are extremely complicated or more complicated than the level of intelligence of that model, the model is going to fail them. Okay, so we are going to model that way. So for example here, if I click on this button, I'm going to see that GPT 5.5 here is going to be able to answer that question because GPT 5 has a theta value of 1.2 and the difficulty of that item is minus 1.2. So the probability of the right answer is 99. Okay, so with that in mind, what we are doing right here is actually calibrating each question, each item. So we are going to improve a lot our estimations. We are going to improve also our confidence intervals and many other properties. The other thing that I want to explain here is theta and B is going to be a pair of numbers that are distributed with normal distributions. So we can actually interpret them. For example, item of B equals 0 means that it's going to be average. Half of the models in my dataset are going to be able to answer that question 50% of the time. So that's going to be extremely helpful because right now to evaluate benchmarks, we need that reference compared with other models. So it's better to have one by default with this methodology. Actually, this model is called item response theory, which is the evolution of classical test theory. Okay. So on top of that, I'm going to have another parameter. It's going to be the slope, the discrimination of that item. So high discrimination are going to have steeper functions. Also, we can have random functions, items that are not related with intelligence, which I don't want, but something happens. And even worse, we're going to have items that have negative correlation with the actual intelligence of the model. So keep that in mind because each item is going to be at difficulty level, B, and it's going to have a discrimination parameter here, A. So, last thing that you need to understand is how can we estimate the intelligence level of a given model if we have IRT, Item Response Theory. We're going to actually go one by one for each question here. So I'm going to plot here on top its item curve, and below you are going to see the relative likelihood of zeta. That's the estimation of the intelligence. So, as you can see here, we are going to use all the curves to combine them in one distribution. Over time, obviously with more questions, we're going to have a better estimation. So, if we add all of them at the end, I'm going to have my final estimation. That is extremely nice to have a distribution here because I can have a likelihood interval, which with classical test theory is more complicated to have. Okay? So, even with that, with the shared scale with B and theta, even with the likelihood interval, if you think that this is not useful at all, let me show you one last example. Okay? Again, this is real data. So, I'm going to compare two models. Here is going to be, on the left side, Claude Opus 4.1. Yeah? That has 245 right answers. On the other side, we are going to have Gemini 3 Pro, which has 247. Okay? So, as you can see, the difference here is quite small for 337 questions. But if you use item response theory, you can see that the difference between all of them is almost one standard deviation. That means Gemini 3 Pro is by far more intelligent. Okay? Which makes sense because it's a later model. Cool. Okay. So, as you can see, counting the number of right answers is not a good approach, because I Yeah? That has 245 right answers. On the other side, we are going to have Gemini 3 Pro, which has 247. Okay? So, as you can see, the difference here is quite small for 337 questions. But if you use item response theory, you can see that the difference between all of them is almost one standard deviation. That means Gemini 3 Pro is by far more intelligent. Okay? Which makes sense because it's a later model. Cool. Okay. So, as you can see, counting the number of right answers is not a good approach, because I can create benchmarks that are not quite rated, and even if I get a lot of right answers, I'm not more intelligent than other models. That could happen, for example, if Gemini is able to answer by far harder questions. Even if Claude is able to answer more of them, maybe Claude was able to answer only the easiest one. So, the theta levels should be different. Okay? That's actually what happens with IRT. You have weather estimations, you have more parameters to define each item, which is going to be helpful later. And also, you have, as you can see here, likelihood intervals. So, on top of everything, I'm going to show you a few applications that you can use with IRT, and I hope that you find them interesting. Okay, so the first application is going to be one of my favorite ones, actually, because you can apply this with one skill that I'm going to show. It's going to take a few minutes if you have the data. And you can actually pick the best items, the best questions on your benchmark, and remove the other ones that are not working, or even fix them. Okay? So, we can audit our benchmark. So, remember that we have two numbers that represent each item, each question. We have B, difficulty, and A, which is the slope or the discrimination of the item. On the right side here, we have very good items, very informative ones. Here, close to zero, we have noisy, with little signal. And on the other side, we have items that we don't like at all, negative items. Here, for example, you can see that we have items that correlate the other way around, that better models are actually getting that answer wrong, which makes no sense. So, we can use this to actually find items that are significantly below zero, and we can actually flag them. With that, I'm going to use another LLM to actually evaluate them. So, here, you can see two items that I detect with that technique. The first one is actually, I don't know the answer. I asked ChatGPT. And apparently, the gold answer, the answer that is on the benchmark, is not the right one. Okay? So, this is okay. But the next example is by far more interesting for me, because the answer is right. So, it's something that a lot of people can miss. So, here, it's asking what is the total number of passengers. The gold answer, the answer that is on the benchmark, is 583, which is the total people killed, passengers plus crew. But the right answer, if you pay attention, I'm asking only about passengers, which is another number. So, again, with a very little effort, if you have the data set, you can actually find items that are mislabeled. This is the most common thing. But sometimes, they are not mislabeled. They are bad items. So, you should remove them or even improve them. This second application for me is amazing. It saves a lot of time, a lot of tokens, and therefore, a lot of money. Okay? So, it's quite common for organizations to have their own benchmarks to evaluate which model is better for them. Especially with open source models. With that in mind, it's quite important to reduce the size of the benchmark, to find the optimal size of the benchmark. Before, we couldn't do that, because we didn't have any property of the item. But right now, with item response theory, we can actually pick the best items. Okay? So, this is a simplification. But we are going to say that items with high levels of discrimination are going to be the best ones. Okay? With that in mind, I can do this. So, again, real benchmarks with real data. For this benchmark, I'm going to target a 99 correlation with the original ranking. So, it's going to be almost perfect for many users' cases. And what we are going to do is pick one by one, starting with the best item. The item with the highest A. So, with that methodology in mind, we are going to get that around 97 items compared with 484. That's almost 5X. We are going to have the same ranking than before, or almost the same ranking as before. To be fair, I try to do the same thing, but randomly. So, if you pick items by random, you are going to observe by far worse performance. So, it's extremely helpful. Maybe this is weird for you, because if we can evaluate items with by far less questions, why are actually using all the benchmark? And the answer for that is that we are not used to calibrate benchmarks. We are assuming that more questions means better estimation, which is not true. For example, I can have two questions that overlap. Their curves are more or less the same. So, even if I ask two of them, I'm going to get more or less the same information about your intelligence. Okay? So, there are a few items that you can notice that they are not extremely informative. They don't correlate with actual intelligence. So, you can reduce them or use them less. I'm not saying that you should remove the rest of the dataset, but you can use this for another application that we are going to talk, that you can use a subset of items. It's time that you apply the benchmark, which is going to be extremely useful. But be careful, because this does not happen on every benchmark. Okay? So, for example, GPQA, which is an extremely well-designed dataset benchmark here, as you can see, even if you pick at random, you are going to get more or less the same result. And the reason for that is that every item here is extremely discriminative, and also they don't overlap. So, they are all of them useful at every time along the benchmark. Okay? That you can use a subset of items. It's time that you apply the benchmark, which is going to be extremely useful. But be careful, because this does not happen on every benchmark. Okay? So, for example, GPQA, which is an extremely well-designed dataset benchmark here, as you can see, even if you pick at random, you are going to get more or less the same result. And the reason for that is that every item here is extremely discriminative, and also they don't overlap. So they are, all of them are useful at every time along the benchmark. Okay? So now, given that we have for each item one function, we can also calculate the error, the unexpected behavior, the outliers for each question, which is going to be amazing for many applications. We can actually find out if we are leaking information, if we are overfitting with the benchmark, and other kinds of contaminations. So let me go back to the matrix that we started with. And as you can see, every question is going to have the estimation and the actual answer. And that's good, because we can observe a few outliers here. For example, Gemini 3 Pro should be able to answer that question. Actually, our model says that 86% of the times, Gemini should be able to answer that. But even with that, that question is wrong. I cannot say why, but I can actually detect those outliers, those weird patterns. Okay? And with that in mind, we can actually calculate the residuals, the error, for that specific question, which is going to be useful for different applications that I'm going to explain later. The other way around, we can actually see here that, for example, DeepSeq R1 is having here a right answer, even if it's not expected. Okay? Again, that does not mean that we are overfitting or anything. Actually, we can sample the same question more than once, so we can average them together, and maybe with that we can resolve that outlier. But in any case, we have a new tool that we can use to analyze the data. On top of that, actually, in Psychometrics, we have a few techniques to see if the behavior is consistent, if that makes sense. Okay? So, for example, here, I can observe that O4mini is the less consistent one. You can see that it has a lot of red, a lot of green questions here in the middle, which makes no sense. So you should be able to use that to, for example, detect if your inference platform is not working well. Because if, for whatever reason, your inference platform is not actually running the models or the quantization is actually wrong, you are going to observe things like that. Behavior that are not expected. Okay? Should be consistent. So this matrix is not perfect, it's going to have noise, but we should be able to more or less estimate the level of intelligence, given that we can predict more or less what questions are you going to get right and what questions are you going to get wrong. Okay? Again, residuals are going to be extremely helpful for the next application, but only with this, I think you can actually look at the data in another way. Okay, so let's say that you are building a benchmark, a very complicated one, a very expensive one, so you don't want that benchmark to be leaked on the internet, neither you want other organizations to train their models with that benchmark. Okay? Because it's extremely valuable, and if you can protect that benchmark over time, it's going to be more valuable. So with that in mind, we can actually use what we call adaptive testing. Okay? What is that? I'm going to pick a random set of items that are going to be representative of my benchmark, and I'm going to call that an anchor set. An anchor set should be representative of my entire benchmark, and I'm going to use those items with every applicant, with every model from any organization that I'm working with. But for every organization, I'm going to pick one individual set, I'm going to call that fingerprint set, that I'm going to show only to that specific organization. And I can do also the same thing with another one. Pay attention to this, because it's important that I pick extremely complicated items from my benchmark for those fingerprint sets. Over time, let's say a few months later, every organization is releasing their new models, and I'm going to observe, I'm going to run the benchmarks again, and I'm going to use residuals to see if those models are extremely good at those specific questions. So here, this is a synthetic data set. You can see that the average residual for that organization, for that specific fingerprint set, is extremely unlikely. So this is not bulletproof, but this is an extremely good technique that you can use to protect your benchmarks. As you can see here, the average residuals for one organization is by far bigger than the other one. In psychology, it's really important to find out if one of our items actually bias against one specific group. We can use the same techniques to research how models behave with items. So I'm going to show you that with one example. I'm going to split the data set into groups. In this case, I'm going to use open weights and close weights. You can use whatever variable is interesting for you, and even you can create more than one group. After that, I'm going to, for each item, create two different curves for each group. And what we expect, if the item is unbiased, is that both lines are overlapping. If not, we are going to calculate this difference, the gap between those ones, and that difference should be zero or close to zero. In this case, we can detect, we can apply that technique to all items on my benchmark, and actually we can find out that there are a few items that are better for closed weight models and better for open weight models. I'm not going to show the items because I don't want to link them on the internet, but if you apply this technique to a real benchmark, you can actually notice a few patterns there. There are a set of questions that have something in common that are better for open weight models. I cannot pinpoint the real reason for that, but I can say that this technique could be used to understand how they train their models. The last application that I'm going to show you is interesting, it's the most complicated one, but in a way it's the most interesting one. So I'm going to use the residuals to actually have a DNA, a fingerprint for models, and the idea is that we can actually look at them and see if two different models are related somehow. I'm not going to show the items because I don't want to link them on the internet, but if you apply this technique to a real benchmark, you can actually notice a few patterns there. There are a set of questions that have something in common that are better for open weight models. I cannot pinpoint the real reason for that, but I can say that this technique could be used to understand how they train their models. The last application that I'm going to show you is interesting. It's the most complicated one, but in a way it's the most interesting one. So I'm going to use the residuals to have a DNA, a fingerprint for models, and the idea is that we can actually look at them and see if two different models are related somehow. So I'm going to make correlation metrics here, and also I'm going to make a super simple projection. The first thing that you can notice is that there are a few models that are extremely close here. They are from the same lab, and also they have the same history. They are different versions for the same model. Also here, you can observe we have DeepSeq, different distillation of DeepSeq, we have also Qwen. So we can observe some patterns there. It makes sense because if a model has a shared history with other models, we can expect the same kind of errors. Okay? And let me show you a few examples. The first one is going to be this one. If we have two models that have the same base, we expect high correlations between them. In this case, we have 0.38. Okay? Also we can observe that between distillations and its base model, which could be extremely interesting if you want to detect distillations of your model without constant. Also we can detect the same model with different effort levels, which makes sense because it's almost the same thing. And also we can say we can actually detect if we have different versions or evolution of the same model. Here we have Llama, but also work with Gemini here. Okay, so again this is not as useful as others for day-to-day, but I think this opens an area of research to understand how models are related with each other and even detect distillations. I really hope that you find this talk inspiring. My goal here was to open the gates of psychometric research for LLMs. I think we can improve a lot how we benchmark LLMs with very basic math here, but there are a lot of ideas that you should explore because I didn't have time. The first one is multidimensionality and hierarchical models. I'm expecting if we apply them to LLMs to see different skill levels for different kinds of tasks. Also we can merge different benchmarks to improve the estimation of each one of them. It makes sense if you have IRT, and also this has been done in a research paper called meta benchmark that I highly recommend you to read. Also we can add another signal that we think correlates with intelligence, for example latency or tokens. And another very promising idea is to use psychometric models to actually measure alignment and use that for also interpretability. I think mechanistic interpretability could help a lot with psychometrics here. I'm working on all those areas. If you are working on them or you have any idea or you need help to apply them to your benchmark, let me know. Thank you for your time, and here you have all the materials, skills, and benchmarks so you can play around with them. Okay? And, with that in mind, we can actually calculate the residuals, the error, for that specific question, which is going to be useful for different applications that I'm going to explain later. The other way around, we can actually see here, that, for example, DeepSeq R1 is having here a right answer, even if it's not expected. Okay? Again, that does not mean that we are overfitting or anything. Actually, we can sample the same question more than once, so we can average them together, and maybe with that, we can, like, resolve that outlier. But, in any case, we have a new tool that we can use to analyze the data. On top of that, actually, in Psychometrics, we have a few techniques to see if the behavior is consistent, if that makes sense. Okay? So, for example, here, I can observe that O4mini is the less consistent one. You can see that it has a lot of red, a lot of green questions here in the middle, which makes no sense. So, you should be able to use that to, for example, detect if your inference platform is not working well. Because, if you're, for whatever reason, your inference platform is not actually running the models or the quantization is actually wrong, you are going to observe things like that. Behavior that are not expected. Okay? Should be consistent. So, this matrix is not perfect, it's going to have noise, but we should be able to more or less estimate the level of intelligence, given that we can predict more or less what questions are you going to get right, and what questions are you going to get wrong. Okay? Again, residuals are going to be extremely helpful for the next application, but only with this, I think you can actually look at the data in other way. Okay, so let's say that you are building a benchmark, a very complicated one, very expensive one, so you don't want that benchmark to be leaked on the internet, neither you want other organizations to train their models with that benchmark. Okay? Because it's extremely valuable, and if you can protect that benchmark over time, it's going to be more valuable. So, with that in mind, we can actually use what we call adaptive testing. Okay? What is that? I'm going to pick a random set of items that are going to be representative of my benchmark, and I'm going to call that an anchor set. An anchor set should be representative of my entire benchmark, and I'm going to use those items with every applicant, with every model from any organization that I'm working with. But for every organization, I'm going to pick one individual set, I'm going to call that fingerprint set, that I'm going to show only to that specific organization. And I can do also the same thing with another one. Pay attention to this, because it's important that I pick extremely complicated items from my benchmark for those fingerprint sets. Over time, let's say a few months later, every organization is releasing their new models, and I'm going to observe, I'm going to run the benchmarks again, and I'm going to use residuals to see if those models are extremely good at those specific questions. So here, this is a synthetic data set. You can see that the average residual for that organization, for that specific fingerprint set, is extremely unlikely. So this is not bulletproof, but this is an extremely good technique that you can use to protect your benchmarks. As you can see here, the average residuals for one organization is by far bigger than the other one. In psychology, it's really important to find out if one of our items actually bias against one specific group. We can use the same techniques to research how models behave with items. So, I'm going to show you that with one example. I'm going to split the data set into groups. In this case, I'm going to use open weights and close weights. You can use whatever variable is interesting for you, and even you can create more than one group. After that, I'm going to, for each item, create two different curves for each group. And what we expect, if the item is unbiased, is that both lines are kind of overlapping. If not, we are going to calculate this difference, the gap between those ones, and that difference should be zero or close to zero. In this case, we can detect, we can apply that technique to all items on my benchmark, and actually we can find out that there are a few items that are better for closed weight models and better for open weight models. I'm not going to show the items because I don't want to link them on the internet, but if you apply this technique to a real benchmark, you can actually notice a few patterns there. There are a set of questions that have something in common that are better for open weight models. I cannot pinpoint the real reason for that, but I can say that this technique could be used to understand how they train their models. The last application that I'm going to show you is kind of interesting, it's the most complicated one, but in a way it's the most interesting one. So, I'm going to use the residuals to actually have a DNA, a fingerprint for models, and the idea is that we can actually look at them and see if two different models are related somehow. So, I'm going to make correlation metrics here, and also I'm going to make a super simple projection. So, the first thing that you can notice is that there are a few models that are extremely close here, that they are from the same lab, and also they have the same history. They are different versions for the same model. Also here, you can observe we have DeepSeq, different distillation of DeepSeq, we have also Queen. So, we can observe some kind of patterns there. It makes sense because if a model has a shared history with other models, we can expect the same kind of errors. Okay? And let me show you a few examples. The first one is going to be this one. If we have two models that have the same base, we expect high correlations between them. In this case, we have 0.38. Okay? Also we can observe that between distillations and its base model. Which could be extremely interesting if you want to detect distillations of your model without constant. Also we can detect the same model with different effort levels. Which makes sense because it's almost the same thing. and also we can say we can actually detect if we have different versions or evolution of the same model here we have llama but also work with Gemini here okay so again this is not as useful as others for day-to-day but I think this opens an area of research to understand how models are related with each other and even detect distillations I really hope that you find inspiring this talk my goal here was to open the gates of psychomotricial research for LLMs I think we can improve a lot how we benchmark LLMs with very basic maths here but there are a lot of ideas that you should explore because I didn't have time the first one is multidimensionality and hierarchical models I'm expecting if we apply them to LLMs to see different skill levels for different kind of tasks also we can merge different benchmarks to improve the estimation of each one of them makes sense if you have IRT and also this has been done in a in a research paper called meta benchmark that I highly recommend you to read also we can add another signal that we think correlates with intelligence for example latency or tokens and another very promising idea is to use psychomotricial models to actually measure alignment and use that for also interpretability I think mechanistic interpretability could help a lot psychometrics here I'm working on all those areas if you are working on them or you have any idea or you need help to apply them to your benchmark let me know thank you for your time and here you have all the materials skills and benchmarks so you can play around with them